
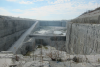
The McCook Reservoir is a ten-billion-gallon reservoir located in La Grange, Illinois. The Metropolitan Water Reclamation District of Greater Chicago (MWRDGC) will own and operate the reservoir when construction is completed. The reservoir is being built in two stages to allow the first stage to be fully functioning while rock is being quarried from the Stage 2 area. Major components include an overburden cutoff wall, distribution tunnels, a main tunnel, dewatering pumps, gates, valves, hydraulic structures, aquifer protection, and an aeration system. The project helps with combined sewer (sanitary and storm) overflows that cause flooding and watercourse contamination in Chicago and 36 suburbs, potentially affecting five million people.
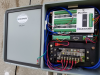
An automated data-acquisition system (ADAS) is collecting data from a network of instruments reporting to 13 remote monitoring units (RMUs) on site. Instruments being monitored include time domain reflectometers (TDRs), in-place inclinometers (IPIs), vibrating wire piezometers (VWPs), and extensometers. RMUs 1 through 13 each read instruments through Campbell Scientific AVW200s and TDR100s, and store data locally on Campbell Scientific CR1000 and CR800 dataloggers.
Previous data-collection procedures included a site visit from the district geotechnical team to manually download data from each individual RMU via handheld PC. The handheld PC was then returned to the district office for upload into an off-network computer, and data was transferred to an air-gap machine for scanning. It was then transferred to the network where it was uploaded into a remote database server via Canary Systems’ MultiLogger database console software. The .dat files were then converted into Excel format, and new data was added to master spreadsheets for each RMU manually. Graphical representations of the data were then manually updated to include the new data.
This methodology was inefficient, as it negated the ability to regularly access data and provide early warning of potential failures.
Canary Systems was tasked with providing:
- A wireless method of data transfer and access
- An automated method of graphical data visualization for analysis
- The design and installation of a new automated audio-visual early warning system for a new base station, monitoring critical areas of concern
- The integration of additional vibrating wire crackmeters
The process involved installing a cellular modem for automated data transfer both at 6 hour intervals and at 5 minute intervals to a hosted database server, configured using MultiLogger software to integrate the existing Campbell Scientific electronics installed in the RMUs.
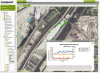
On the hosted server, a website for end users was set up with Canary Systems’ MLWeb software. It includes interlinked aerial and cross-sectional views of the instrumentation, with display of the most recent data as well as historical data. The user is able to select multiple instruments for display on the same graph and adjust the time frame on graphical outputs.
To help with timely data reduction and processing, customized calculations, graphs, and reports were created through MLWeb software to convert and visualize raw data from the field, including calibration and correction factors. For example:
- Correlation of piezometer data, with precipitation plotted on a second y-axis
- Hourly rain-gage data, including cumulative precipitation
- Inclinometer data, including incremental and cumulative displacement values (Special attention was paid to incorporating changes to the inclinometer sensor elevations taking place during the mining season shutdown period.)
- Graphs of relative reflectance with depth for each TDR
- Extensometer data, including incremental displacement versus time
Automated validation rules filter false high or low readings, such as those induced by blasts, or ground vibrations in the tilt sensors from automobiles or locomotives, while retaining the original data in the database.
Data reaching or exceeding thresholds, including rate-of-change thresholds, is highlighted in red in the web portal, while automated alarms and notifications communicate via email to key staff the trigger instruments and their last five reading results. A newly designed early warning system provides immediate audio-visual alarms for the crew in the immediate vicinity.
Sumário de Estudos de Caso
Aplicação
Automating data systems at construction siteLocalização
La Grange, Illinois, USAProdutos Utilizados
CR1000 CR800 TDR100 AVW200Organizações Participantes
US Army Corps of Engineering (USACE), Chicago DistrictParâmetros de Medição
Displacement, deformation, water head and depth, precipitation, air temperature, barometric pressure, battery voltagesConsultor/Integrador Participante
Canary Systems, Inc.Ver o PDF